Lung Disease Classification
December 30, 2022
Traditionally, the interpretation of chest X-rays has been performed by radiologists who manually analyze the images and make diagnostic decisions. However, this process can be time-consuming and subjective, leading to variations in accuracy and efficiency. Deep learning models offer a promising solution by automating the analysis process, providing consistent and objective assessments.

Chest X-rays scans are among the most accessible ways to diagnose lung diseases still. This study tries to compare the detection of lung diseases using these scans from three different datasets using deep neural networks. Three different backbone architectures, ResNet34, MobileNet V3 Large and EfficientNet B1 were used along with a set of models trained using transfer learning. Finally, models are visualized using t-SNE and gradCAM to understand the features learned by the models and correlate them with the actual effect of the diseases on the lungs.
Dataset Used
We have choosen 3 types of chest X-Ray datasets (Tab. 1) that have varying disease types to ensure that our models are robust. The main concern while selecting the datasets was the number of images per class as most datasets were highly skewed. We rejected datasets where the images were compressed and noisy as this can lead to mis-diagnosis. This will help reduce the time spent in the pre-processing stage. The dataset links are as follows:
- Dataset 1 - Kaggle Link
- Dataset 2 - Kaggle Link
- Dataset 3 - Kaggle Link
A sample of the dataset can be downloaded from the following link
| Dataset | No. of Images | Classes | Image Size |
|---|---|---|---|
| Dataset 1 (COVID) | 10k:3.6k:1.3k |
3 |
299x299 |
| Dataset 2 (PNEUMONIA) | 3k:1.5k:1.5 |
3 |
224x224 |
| Dataset 3 (Chest Xray8) | 25k:12k:6k:5k:3k:2.7k:2.6k |
7 |
1024x1024 |

Methodology
In this study, 12 models, four for each of the three datasets will be trained.
- The first three models will be trained from scratch and the fourth model will be trained using transfer learning. The hyperparameters will be fixed across models to produce comparable results.
- Next, hyperparameters will be tuned to find the best model.
- Finally, the models will be visualized using t-SNE and Grad-CAM to explain model results.
A. Pre-processing Techniques
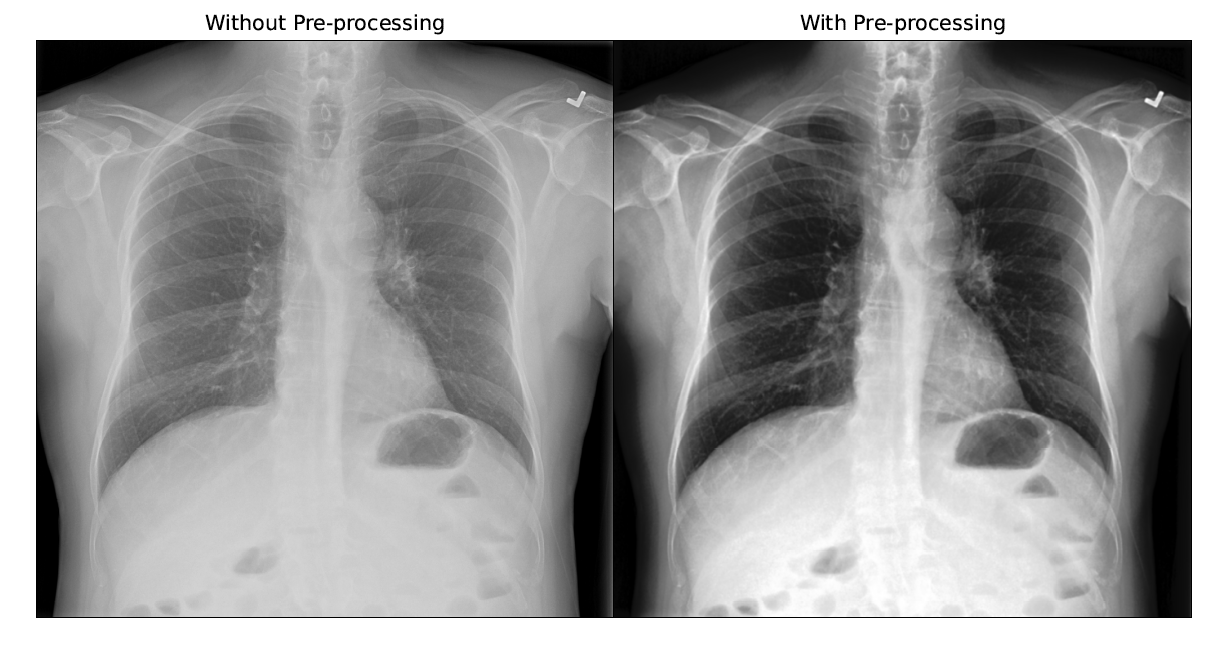
Before training, the images were analysed to come up with pre-processing techniques such as Histogram Equalization and Gaussian Blur with a 5x5 kernel as Giełczyk et al. showed that this improved the F1 score by 4% for chest X-ray classification. Visually, the contrast of the scan improved and allowed irregularities to stand out as shown in the figure below.
B. Data Augmentation
During training, the scans were augmented using RandomAdjustSharpness and RandomAutocontrast in Pytorch to increase the number of images the model gets to learn from and ensure that the model is robust to scans from different machines. RandomHorizontalFlip was also used to make the models invarient to the direction of the scan as some scans were anterior-posterior while others were posterior-anterior.
C. Architectures
Different backbone architectures were chosen to ensure that different types of convolution blocks were tested and finally Resnet-34, MobileNet V3 Large and EfficientNet B1 were chosen finally because of there Imagenet Accuracy and number of training parameters.
| Architecture | Params (Mil.) | Layers | FLOPS (Bil.) | Imagenet Acc. |
|---|---|---|---|---|
| MobileNet V3 Large | 5.5 | 18 | 8.7 | 92.6 |
| EfficientNet B1 | 7.8 | 25 | 25.8 | 94.9 |
| Resnet-34 | 21.8 | 34 | 153.9 | 91.4 |
Experimental Setup
First undersampling was performed on the datasets. Then, the scans were preprocessed using histogram equalization and Gaussian blur before resizing them and storing them in separate directories to make it easier for PyTorch dataloaders.
Two datasets in this study presented the multiclass classification problem while the third, chest X-ray 8 dataset presented the multiclass, multilabel classification problem. Thus, the training methodology was separated for these two problems. For the multilabel problem, a softmax layer had to be added before the loss function to get 0 or 1 prediction for all the classes of the data. For this, the BCEWITHLOGITSLOSS function of PyTorch was used as it combines the Sigmoid layer and the BCELoss function in one single class. This makes theses operations more numerically stable than their separate counterparts.
The backbone architectures were obtained directly from the torchvision library and the final classification layer was modified for the selected datasets. For the models which had to be trained from scratch, the weights were randomly initialized and the entire model was trained for a total of 100 epochs each.

The above figure represents Train & Val, F1 & Loss plots for the 9 models. Initial training runs of the multilabel data produced a zero F1 score due to its highly imbalanced nature. To mitigate this, class wise weights were calculated and used with the loss function. This improved the F1 score considerably. Finally, the best models from each run by validation loss were used to get the test set metrics that are displayed in the tabel below.
| Model | Resnet | Mobilenet | EfficientNet | ||||||
|---|---|---|---|---|---|---|---|---|---|
| Dataset | F1 Score | Time | Epoch | F1 Score | Time | Epoch | F1 Score | Time | Epoch |
| Pneumonia | 0.784 | 82 | 22 | 0.804 | 75 | 42 | 0.768 | 110 | 44 |
| COVID | 0.959 | 50 | 21 | 0.967 | 37 | 44 | 0.979 | 56 | 46 |
| X-Ray 8 | 0.411 | 11,502 | 19 | 0.406 | 7,275 | 42 | 0.445 | 13,820 | 31 |
Result Analysis
• It is clear that going from a smaller architecture to a bigger architecture, makes the model start to overfit earlier. The MobileNet model was the most unstable among the three and also took more epochs to reach the minima. The EfficientNet algorithm performs best for the COVID and Chest X-ray 8 dataset and all three architectures performed similar for the pneumonia dataset. This shows that the compound scaling of EfficientNet gives good results for chest X-ray data.
• The X-ray 8 dataset performed the worst among the three datasets which could be due to the high number of classes, class imbalance and the multilabel nature of the problem. Surprisingly, the pneumonia dataset performed worse than the COVID + pneumonia dataset which indicates that COVID cases are easier to distinguish from pneumonia cases.
• It can be seen that the MobileNet architecture was the fastest to train per epoch. It consistantly took less time per epoch but, if number of epochs required to converge is considered, it does not train the fastest all the time. It is also evident that ResNet converged the fastest at half the number of epochs compared with other models.
• EfficientNet models perform the best in terms of the overall F1 score on the test set with the exception of the Pneumonia dataset where surprisingly MobileNet performed the best. An F1 score of 0.8 for the pneumonia dataset was obtained, 0.98 for the COVID-19 dataset and 0.46 for the multilabel chest X-ray 8 dataset.
Transfer Learning
As EfficientNet gave the best for COVID and chest X-ray 8 dataset, it was chosen for transfer learning. The model was trained from scratch with ImageNet weights and was applied for classification on the COVID, Pneumonia and Chest X-ray 8 datasets. For the transfer learning models, the weights were initialized with the IMAGENET1K_V2 weights but the entire model was fine-tuned. The rationale behind performing deep-tuning was that the Imagenet data is very different from chest X-ray scans thus the model would need to learn features from Xray scans.

The figure below represents Train & Val, F1 & Loss plots for the 3 transfer learning models. It can be seen that the transfer learning model had a much better start than the randomly initialized model. It also converged much quicker than the model trained from scratch. For the Pneumonia dataset, the model trained from scratch was highly unstable at the start and could not catch up to the transfer learning model even after 100 epochs in terms of the F1 score.
| Model | EfficientNet-Transfer Learning | ||
|---|---|---|---|
| Dataset | F1 Score | Time | Epoch |
| Pneumonia | 0.782 | 114 | 70 |
| COVID | 0.978 | 56 | 43 |
| X-Ray 8 | 0.457 | 13,813 | 29 |
Transfer Learning Analysis
• The transfer learning models converged quicker than the other models with the exception of the Pneumonia dataset. Another observation is that the EfficientNet model takes the longest to train per epoch even though the number of trainable parameters is nowhere close to ResNet.
• Also, MobileNet isn’t as fast to train as expected when compared to ResNet even though it has 4 times the learnable paramenters. This could be due to two reasons, depthwise convolutions are not optimized in the version of PyTorch and CUDA used and training is getting CPU bound due to the data augmentation before each training run which would take the same amount of time for all the models.
T-SNE and Confusion Matrices
The figures below represent T-SNE and Confusion matrices for the test set of the Pneumonia dataset.

These t-SNE plots and confusion matrices show that the models are able to differentiate well between the normal and pneumonia classes but struggle with the viral pneumonia vs bacterial pneumonia classification. MobileNet performs better but the EfficientNet transfer learning model creates better separation of classes.
Thus, even though MobileNet performs better in this case, the EfficientNet transfer learning model would generalize well on new unseen data. This is correlated in the confusion matrix where the transfer learning and MobileNet models perform the best.
Similarly, for the figure represents T-SNE and Confusion matrices for the test set of the COVID dataset.

T-SNE and Confusion Matrices Observations
• The above plots and confusion matrices also show that all models do a good job of separating classes to create distinct clusters but, the transfer learning model creates better clusters with separate smaller clusters.
• These smaller clusters could indicate other factors of the disease, for example the severity and amount of lung damage caused by the disease. This performance of the transfer learning model can be confirmed by looking at the confusion matrix as well.
Grad-CAM Visualizations
The figure below shows the gradCAM visualization of the last layer of the convolutional network. Here, it can be seen that ResNet is learning completely different features as compared to the other models, which could be a reason of its poor performance.
In case of bacterial pneumonia, the network identifies affected area on the right side of the scan and on the other hand, incase of viral pneumonia, models look at both sides of the lungs.

Now, comparing it to the gradCAM visulization of the COVID dataset. The figure below shows shows that MobileNet activates the entire image incase of COVID, this could be the reason for its low performance.
In case of pneumonia, the Efficient- Net models identifies affected areas on the bottom of the lungs. On the other hand, in case of COVID, the models look at a bigger region of the lungs.

Ablation Study
For the ablative study, the COVID dataset was chosen along with the EfficientNet B1 architecture trained from scratch. The learning rates chosen for the study are 0.001, 0.005, 0.01, 0.05, and 0.1.

• From the training and validation F1 score and loss plots given in the figure above. it is seen that a very high learning rate of 0.1 is highly unstable and prevents the model from reaching close to global minima. Similarly, learning rate of 0.05 also prevented the model from converging on the validation set even after 100 epochs.
• The other three learning rates all converged on the validation set but, the learning rate of 0.001 was the most stable and reached the highest F1 score earliest. On the other hand, learning rate of 0.01 performed marginally better on the loss plot.

• From the figure above it can be seen that the best performing learning rate is 0.001 on the F1 score of the test set with 0.005, 0.01 close seconds and 0.05, 0.1 performing the worst. This matches the results of the validation set. Thus, a learning rate of 0.001 performs the best on the COVID dataset with transfer learning.
Acknowledgments & Feedback
I am grateful to have worked alongside Rohan Chopra who has helped me understand the essence of data pipeline generation, segregating tasks into workable components and to transform just jupyter notebooks into workable projects.
His profound understanding of machine learning concepts, algorithms, and techniques have greatly enhanced my interpretations and ability to tackle complex problems. He has consistently provided insightful feedback, constructive criticism, and practical suggestions, which have significantly improved the quality of our work together.
I would also love to receive suggestions or any feedback for this writing. It has been written as per my understanding and the learnings I kindled during my journey. I hope you find it useful and easy to understand.